IRENA estimate · end-2025 · national reporting basis
AFRICAN RESOURCE / SOUTH AFRICAN CAPACITYEnergy opportunity.
Energy opportunity.
Evidence in view.
Explore long-term solar resource, published capacity snapshots and selected PV and BESS projects. Sources, units, dates and coverage remain visible.
01 / AFRICAN SOLAR RESOURCESee the resource.
See the resource.
Understand the measure.
Original Solargis long-term resource maps, with their legends and attribution retained. Explore irradiation and PV potential as separate layers.
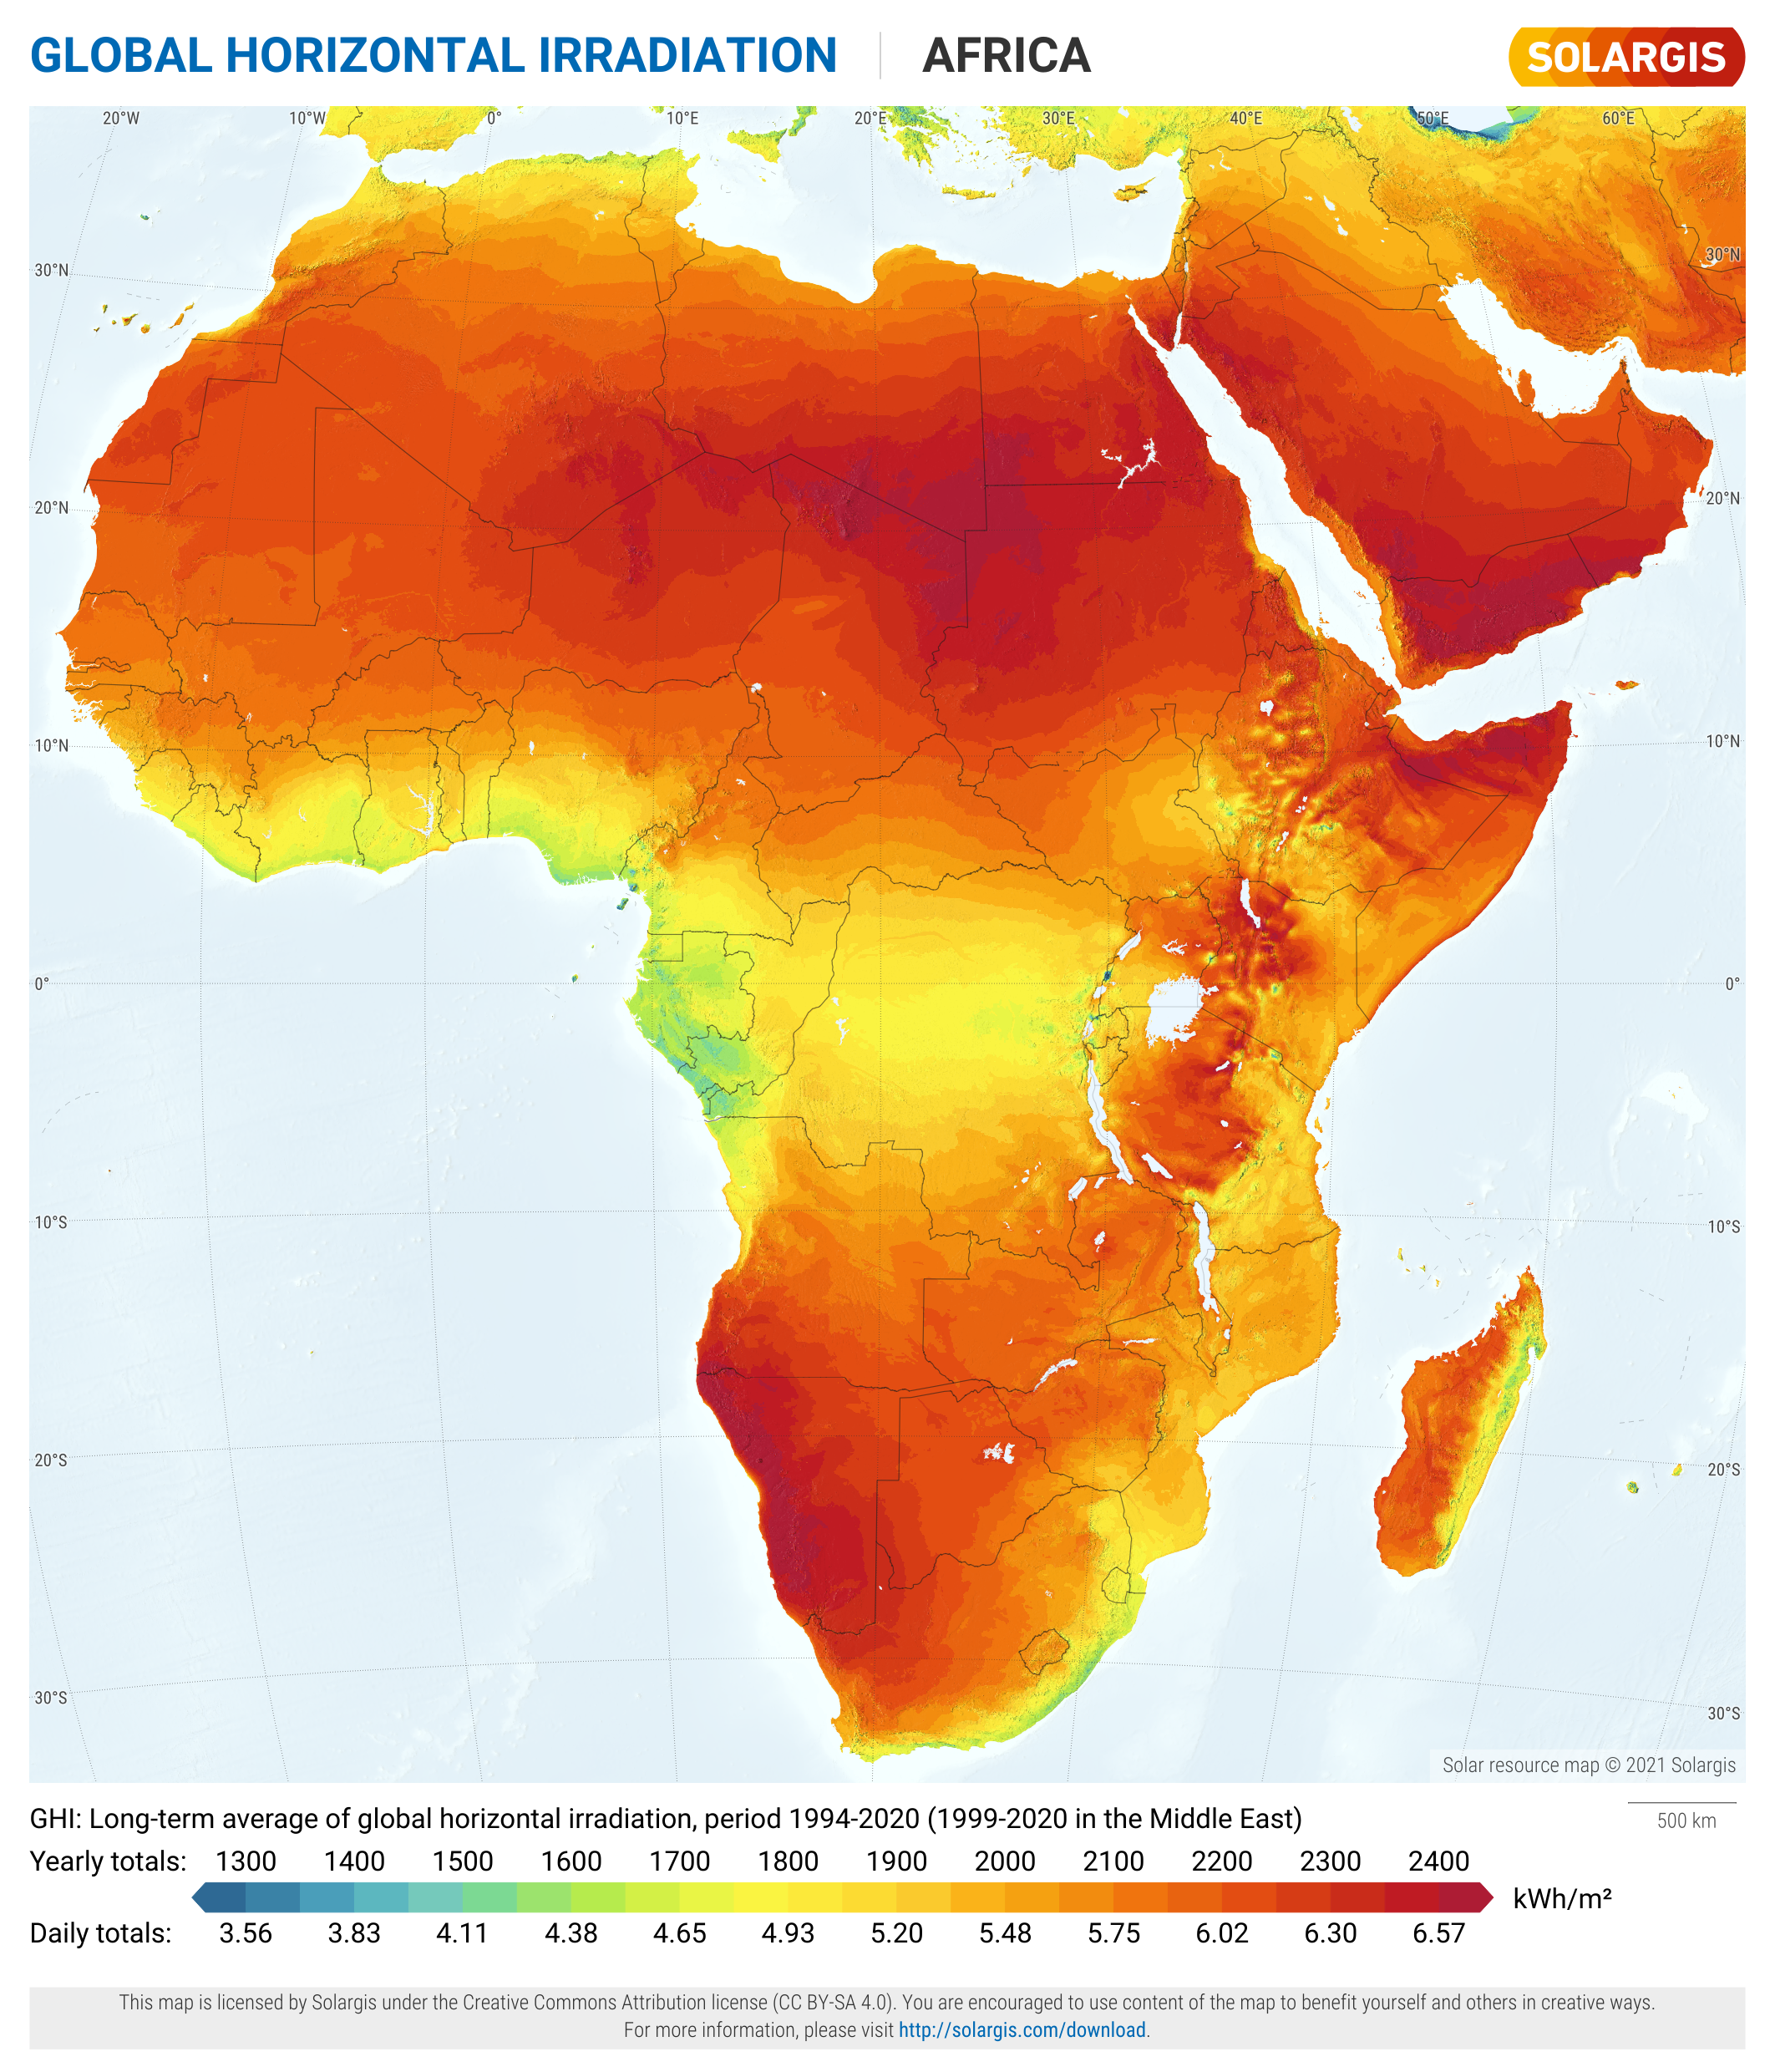
Solar resource map © 2021 Solargis · CC BY-SA 4.0 · Original, unmodified map images, version 20210430. Retrieved 20 October 2026.
Download full-resolution map ↧SOUTH AFRICA / PUBLISHED CAPACITY SNAPSHOTSInstalled. Planned.
Installed. Planned.
Clearly distinguished.
Reporting periods and scopes differ. These published figures are not live telemetry and must not be added into one fleet total.
18 bidders · end-2025 procurement snapshot
Power only · end-2025 pre-close programme snapshot
Verified 20 October 2026. National installed BESS totals have not been established for this release. “Not verified” is not zero. Programme snapshots retain their stated dates and do not imply that every project has reached the next stage.
| Metric | Capacity | Coverage | As of | Evidence |
|---|---|---|---|---|
| Installed solar PV | 10,655 MW | IRENA national estimate; installed and connected at year-end | 2025-12-31 | Basis & sourceIRENA maximum net generating capacity; e = estimate. Not a DC module-nameplate total. No rooftop estimate is added separately; CSP excluded. IRENA Renewable Capacity Statistics 2026, solar PV table, printed p.25 / PDF p.37 ↗ |
| PV under construction — BW6 only | 360 MW | Two REIPPPP Bid Window 6 projects only | 2025-12-31 | Basis & sourceSource-reported project MW; AC/DC boundary not specified in cited passage. Partial programme scope; not total South African PV under construction. National Treasury, 2026 Budget Review, Annexure D, p.142 ↗ |
| Planned PV — procured BW7 | 3,940 MW | 18 REIPPPP Bid Window 7 bidders | 2025-12-31 | Basis & sourceSource-reported procurement MW. Procured does not mean commissioned, construction-started or financially closed. National Treasury, 2026 Budget Review, Annexure D, p.142 ↗ |
| Installed BESS power — national | Not verified | Whole-country total not verified | Not established | Basis & sourcePower. Selected public assets are documented; this release does not assert an exhaustive national total. Eskom Hex commissioning announcement ↗ · Scatec South Africa asset portfolio ↗ |
| Installed BESS energy — national | Not verified | Whole-country total not verified | Not established | Basis & sourceEnergy; usable/gross boundary not harmonised. Missing data is not zero. Pumped storage is excluded. Eskom Hex commissioning announcement ↗ · Scatec South Africa asset portfolio ↗ |
| BESS construction — BW1 | 513 MW | Five BESIPPPP Bid Window 1 projects | 2025-12-31 | Basis & sourceSource-reported programme power. An end-2025 programme snapshot; project-specific subsequent changes are not inferred. National Treasury, 2026 Budget Review, Annexure D, p.142 ↗ |
| BESS construction energy — BW1 | Not verified | Same BW1 programme; energy aggregate not verified | 2025-12-31 | Basis & sourceEnergy. No assumed storage duration is used to derive MWh. National Treasury, 2026 Budget Review, Annexure D, p.142 ↗ |
| Planned BESS — BW2 + BW3 | 1,231 MW | BESIPPPP BW2 (615 MW) + BW3 (616 MW) | 2025-12-31 | Basis & sourceSum of two disjoint programme windows. 615 + 616 = 1,231 MW. Excludes BW1 construction; not a complete private-sector pipeline. National Treasury, 2026 Budget Review, Annexure D, p.142 ↗ |
| Planned BESS energy — BW2 + BW3 | Not verified | Same two programme windows; energy aggregate not verified | 2025-12-31 | Basis & sourceEnergy. Not estimated from a generic four-hour assumption. National Treasury, 2026 Budget Review, Annexure D, p.142 ↗ |
PV MW and BESS MW/MWh remain separate. IRENA values are estimates of maximum net generating capacity, not DC module nameplate. Source-reported programme MW have no further AC/DC conversion here. CSP and pumped storage are excluded.
03 / SELECTED SOUTH AFRICAN PROJECTSProjects, with
Projects, with
their evidence attached.
Seven publicly documented examples. This is a starter register, not an exhaustive national pipeline or a GES project portfolio.
Industry information only. Inclusion does not imply that GES designed, delivered, owns or endorses a listed project. Status reflects the cited disclosure date, not a real-time availability check.
SOUTH AFRICA / PROVINCE EXPLORERChoose a province.
Choose a province.
Explore its projects.
Map and panel links open the same province page. Coverage is the selected seven-project register, not complete provincial capacity statistics.
Boundary source: OCHA ROSEA / South African Municipal Demarcation Board, via geoBoundaries gbOpen. Geometry represents 2020 boundaries; provider update 2023. CC BY 3.0 IGO. Simplified geometry projected equirectangularly at 28°S; not a cadastral/site-location map. Provider spelling “Nothern Cape” is displayed as Northern Cape using its NC identifier.
Loading map values…
Eastern CapeOpen province ↗Free StateOpen province ↗GautengOpen province ↗KwaZulu-NatalOpen province ↗LimpopoOpen province ↗MpumalangaOpen province ↗North WestOpen province ↗Northern CapeOpen province ↗Western CapeOpen province ↗
Hatched fill means no matching verified capacity in this dataset, not zero installed capacity. PV MWac values remain unverified where owner-reported MW are not harmonised. Unknown-province records remain in the national register.
View all register records, including unallocated locations ↗Province register panels
Counts relate to this register only. Province-level navigation, not a geographic-scale map or precise site-location layer.
Loading approved project records…
| Project / owner | Technology / province | Capacity | Status / date | Evidence & scope |
|---|
PV figures retain owner-reported MW and are not totalled across unharmonised AC/DC boundaries. Filtered BESS subtotals are grouped by status and are never national totals. Hybrid components and whole-project phases are recorded once.
DATA NOTESA dated snapshot.
A dated snapshot.
An auditable source trail.
Verified 20 October 2026. This release is a reviewed static snapshot, not an automated live feed. Refreshing the page does not fetch new national statistics. A snapshot older than 90 days is flagged for review.
- IRENA Renewable Capacity Statistics 2026, solar PV table, printed p.25 / PDF p.37 ↗Published: 2026-03. End-2025 maximum net generating capacity; South Africa PV value marked e (IRENA estimate). © IRENA 2026. Excludes CSP.
- National Treasury, 2026 Budget Review, Annexure D, p.142 ↗Published: 2026-02. Programme snapshots at end-December 2025. Programme capacity is not a full national project census.
- Scatec South Africa asset portfolio ↗Published: Undated; checked 2026-10-20. Undated owner portfolio, checked 20 October 2026. Retains owner-reported status and units.
- Scatec Grootfontein commercial-operation announcement ↗Published: 2025-12-06. Owner identifies 273 MW and Western Cape.
- Scatec / Lyra Thakadu construction announcement ↗Published: 2026-03-06. 255 MW in two phases; only phase-one start confirmed by this dated announcement. Phase-one COD targeted H1 2027.
- Scatec Mogobe financial-close announcement ↗Published: 2024-10-18. 103 MW / 412 MWh near Kathu, Northern Cape; current portfolio supplies the construction status.
- Scatec Haru preferred-bidder announcement ↗Published: 2025-05-30. 123 MW / 492 MWh, Free State. Preferred bidder; current portfolio lists backlog. Do not infer commercial close from an elapsed target date.
- Eskom Hex commissioning announcement ↗Published: 2023-11-10. Commissioned Hex asset, Worcester, Western Cape, 100 MWh. Evidence of commissioning does not certify present availability.
- Eskom Distribution IPP conference presentation, May 2025 ↗Published: 2025-05. Hex River label identifies 20 MW / 100 MWh.
- Globeleq Red Sands project page ↗Published: Undated; checked 2026-10-20. Owner reports 153 MW / 612 MWh, Northern Cape, present status Construction; checked 20 October 2026.
- Solargis free maps — Africa ↗Published: 2021-04-30. Solar resource map © 2021 Solargis. CC BY-SA 4.0. Long-term period 1994–2020; Middle East 1999–2020. Original map images retained with legends and attribution.
Reconciliation rules
- Do not sum national installed PV and procurement windows into one current fleet.
- Do not add project-register records to national totals or to procurement totals: populations overlap.
- BW2 and BW3 are disjoint windows; only their power ratings are summed.
- Do not convert owner-reported PV MW to MWac/MWp without supporting evidence.
- No coordinates inferred; province-level overview only.
- Undated owner pages are marked as checked, not as newly published.